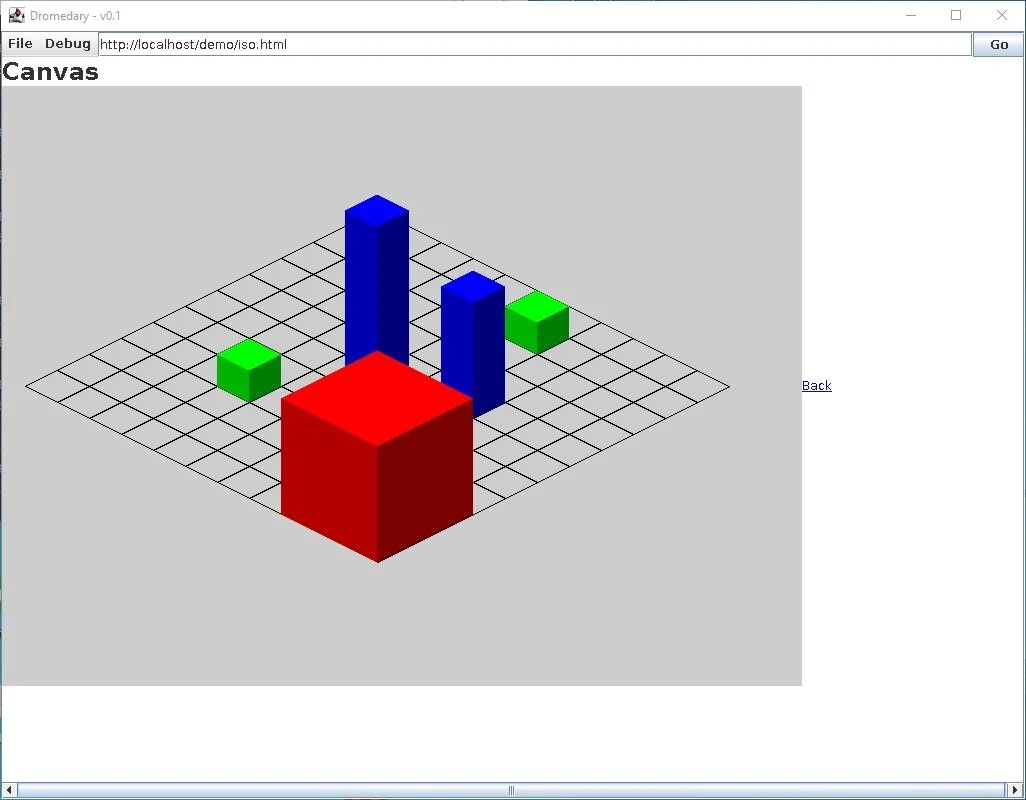
It’s time to do something graphical, so instead of implementing support for boring old tables, lets implement the canvas element.
2D Graphics - The Canvas
The canvas element allows developers to draw 2D (and 3D with WebGL) graphics via the use of various drawing functions. Implementation wise this wasn’t too difficult as the Java Graphics library effectively mirrors the functionality that I wish to implement which was very convenient. In regards to scope, I’m aiming for a mostly compatible adaptation of the W3C canvas API for the 2D drawing functions at least. Maybe I’ll do something bespoke for the the 3D implementation - that can wait though.
Implementing the Canvas Component
Logically one would think that I used to canvas AWT component to represent the view of the canvas element right? Wrong! This is because its generally not advised to mix and Swing and AWT components together because several weird graphical glitches tend to happen. One which I observed was some overlapping that was occurring between the menu bar, scroll bar and the canvas. Due to this, an ordinary JPanel was used.
One other interesting thing about the view is that the drawing operations aren’t invoked on the Graphics object supplied by the JPanel itself, but rather an instance of a BufferedImage which in turn is drawn to the panel. This design means that other system components can access and manipulate the image buffer. One use case I can think of is the desire to record a video of the content being displayed on the canvas - i.e. screen capturing.
Demo Time
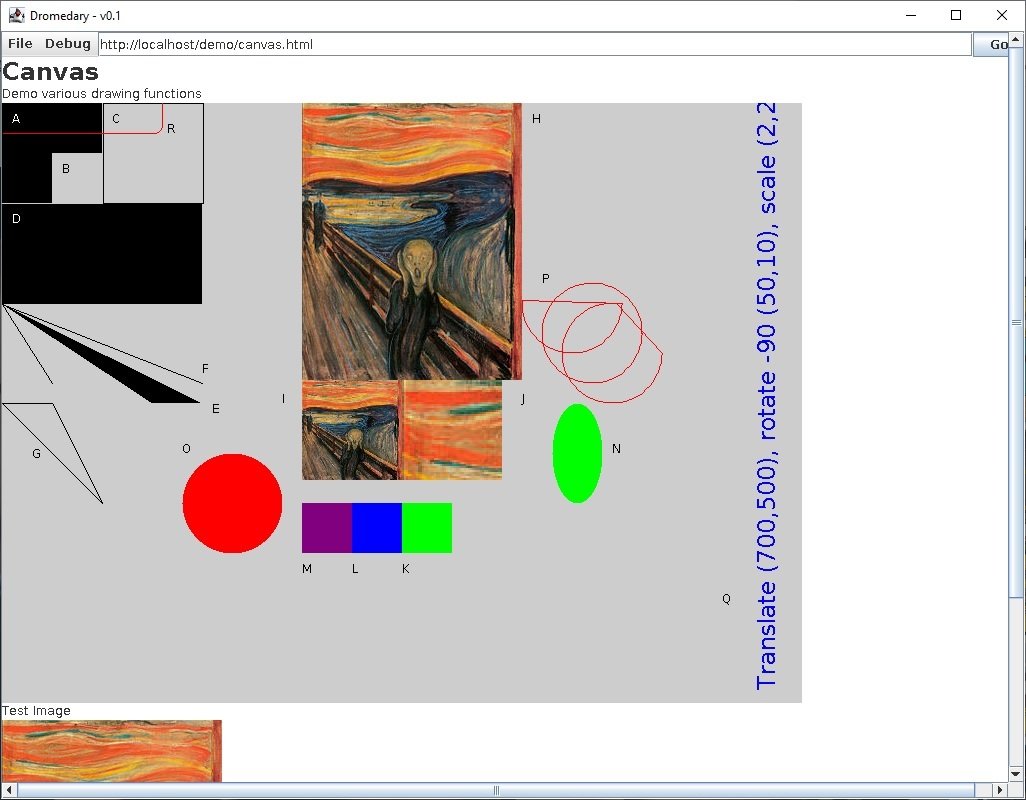
Let’s breakdown the second screenshot and describe the functionality.
A) - Fill rectangle, pretty straight forward. Draw a rectangle (or square) at the given origin and fill it according to the current fill colour. The example fills a black square 100 x 100 pixels, at origin (0, 0).
B) - Clear rectangle. Similar to fill rectangle but uses the background colour of the component as the fill colour, giving the appearance of clearing a section from the canvas. The example clears a 50 x 50 pixel square at origin (50, 50).
C) - Draw (stroke) rectangle. Dimensions and location are provided in the same way as fill rectangle, but the resulting shape isn’t filled in, only the outline is coloured.
D) - Fill rectangle again, but the dimensions are changes so that the resulting shape is actually a rectangle.
E) - Fill path. A “path” of points is created using the moveTo() and lineTo() methods. After closing the constructed path, the polygon that’s created is filled with the current fill colour.
F) - Draw (stroke) open path. Like E, however the path created isn’t closed and is drawn and not filled.
G) - Draw (stroke) closed path. Like F, however the path is closed. Resulting in a triangle being drawn.
H) - Draw image. Draw an image - in this case “The Scream” by Edvard Munch - onto the canvas. The image is drawn at a specified location using its original dimensions. The image can be provided by various HTML elements - <canvas>, <img> or <video>, in this example the image is loaded from an img element labelled “Test image”.
I) - Draw scaled image. Like H, however the image can be optionally scaled up or down depending on the users’ choice. in this example the image is scaled down to a 100 x 100 pixel square.
J) - Draw a subsection of an image and optionally scale. Like I (and H) but a sub subjection of the image is sampled and scaled accordingly. In the example screenshot the region (0,0) to (50,50) is sampled and scaled up to 100 x 100 pixels.
K), L), M) - Direct image manipulation. These examples are all demonstrating the same functionality, using getImageData() and putImageData(). They’re reading the region of the canvas that was cleared - see B - and changing the colour of each pixel - K (green), L (blue), M (purple) - by manipulating each pixels’ RGB channels. Once changed the image data is put back into the canvas.
Currently there’s only a few drawing functions from the canvas API that haven’t been implemented, mainly drawing a quadratic and Bézier curve. Only the fill and stroke colour properties have been implemented so far, the other “style” properties - lineWidth, lineCap, lineJoin, miterLimit, shadow properties, fill and stroke styles haven’t been implemented yet.
As I mentioned earlier, developers interact with the canvas by calling several functions by using a scripting language. I was going to elaborate about this scripting language in this post, but I think I’ll save that for the next one.